Influenza Medical Staff Analysis
Project Overview
The project uses historical data on US influenza activity to identify vulnerable populations, peak seasons, and predict temporary staffing requirements for medical facilities. Utilized Excel for data cleaning and descriptive analysis, and developed a Tableau visualization report. The purpose of this analysis is to:
Analyze historical data on influenza activity to identify trends and predict peak season timing.
Prioritize staffing allocation to regions with the highest predicted need.
Data Source
Tools & Skills
Software: Tableau & Excel
Data Profiling and Mapping
Statistical Analyses and Data Visualizations
Deliverable
Key Questions
How many Americans have died from influenza?
Does Influenza spile at a certain time of year?
Which age groups face the highest death risk?
Which states are most vulnerable during flu season?
Analysis Process
1. Design Data Analytics Project Plan
Outline the objectives, scope, communication plan and timeline for conducting the analysis to address specific business questions.
2. Profile and Integrate Data
Assess data quality, apply necessary transformations, and integrate multiple data sources for comprehensive analysis.
3. Perform Statistical Analyses
Utilize statistical methods to analyze data, uncover patterns, and draw meaningful insights.
4. Create Statistical Visualizations
Develop visual representations of statistical data to effectively communicate insights and findings.
5. Conduct Spatial Analysis
Analyze and visualize geographic data using Tableau to identify spatial patterns and relationships.
6. Present Findings to Stakeholders
Communicate analysis results, insights, and recommendations to stakeholders through clear and compelling presentations.
Data Analytics Project Plan
The Flu Season Staffing Analysis project aims to predict temporary staffing needs for medical facilities during influenza season using data analytics.
The documentation outlines the roles and responsibilities, budget, and timelines, facilitating effective resource allocation and project management. It also specifies communication strategies to keep everyone updated on progress and changes.
Statistical Analysis & Research Hypothesis
Our descriptive analysis is conducted after the cleaning, profiling, and quality measures of both Influenza Deaths and Population data sets have been completed. The integrated data set contains 459 observations with state and year variables, influenza deaths, and population breakdown by age group.
Research Hypothesis
If patients are over 65 years old then they will have a higher chance of mortality from Influenza.
Null Hypothesis (H0): There is no difference in the mortality rate from Influenza between patients over 65 years old and those younger than 65.
Alternative Hypothesis (Ha): Patients over 65 years old have a higher chance of mortality from Influenza compared to those younger than 65.
Data Spread & Correlation
In 2009-2017, influenza deaths among over 65-year-olds averaged 953 with a standard deviation of 940, and the population averaged 807,145 with a standard deviation of 887,025.
The correlation coefficient between influenza deaths among people over 65 is close to 1, which means that influenza deaths are strongly correlated with this age group.
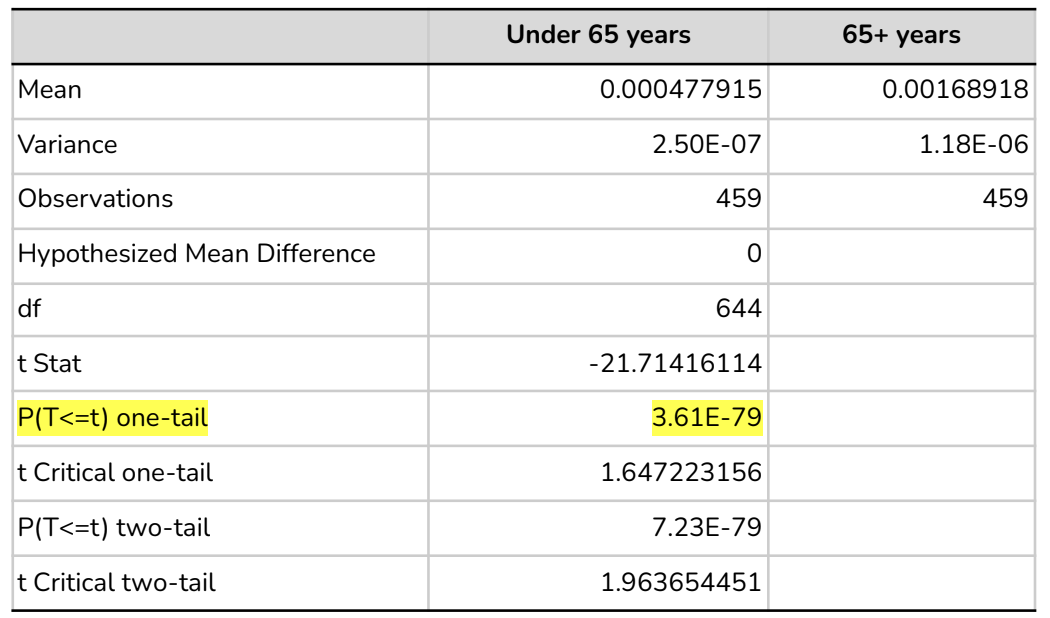
Hypotheses Tested Parameters
Independent variable: Age Groups
Dependant variable: Influenza Death Percentage
Test type: One-tailed test
Significance level: 0.05
Hypotheses Tested Result Summary:
Since the p-value is much lower than the significance level, we reject the null hypothesis (H0) that there is no difference in mortality rates between the two age groups. It is clear from these results that patients over 65 years of age have a higher mortality rate from influenza than those of a younger age group.
Key Insights
CDC estimates that Influenza has resulted in 67,000-74,200 deaths annually between 2009 and 2017. The flu season is a time when hospitals and clinics need to ensure they are providing the best care possible. The best defense against flu season outcomes is a well-planned staff.
The influenza season typically starts in December and ends in March, according to the CDC's data set, with January being the month with the highest number of deaths. The influx of patients often overwhelms healthcare systems during this time, straining resources and increasing the risk of outbreaks.
Adults over 65 are at significantly higher risk from influenza. Further analysis reveals a strong correlation between population size and influenza deaths in this age group.
California and Florida have a significantly higher elderly population than others followed by Texas, New York, Pennsylvania, Illinois, and Ohio. Additionally, California has had the highest number of influenza-related deaths between 2009 and 2017
Recommendations
Focus on high-risk states needs
Examined vaccination coverage in high-risk states (California and Florida) and mid-risk states (Texas, New York, Pennsylvania, Illinois, and Ohio) in addition to finalizing the medical staff needs.
Adjust the staff-to-patient ratio based on vulnerable populations
Further analysis of each clinic and hospital's medical visit by age group to determine the need for increased staff or resources in these facilities.
Prioritize staff utilization between December and March during flu season
Assess current staffing levels and determine the extent of the staffing gap during flu season.
Collaborate with healthcare providers to gather data on patient influx and adjust staffing needs.
Develop a contingency plan to address any unexpected steff needs.


