Telco Customer Churn Analysis
Project Overview
This data analysis project dives into customer churn for a fictional California-based telecommunications company using Python and data analysis techniques. By examining customer demographics, service usage, satisfaction scores, and financial metrics, the project aims to:
Understand customer churn: Analyze factors influencing customer churn, such as demographics, service subscriptions, satisfaction levels, and customer lifetime value.
DIdentify high-risk and high valued customers: Develop a churn prediction model to identify customers at high risk of leaving the company.
Develop customer retention strategies: Utilize insights from the analysis to recommend targeted marketing campaigns, service bundles, and loyalty programs to retain high-value customers and reduce churn.
Data Source
Telco customer churn Data Set - via Kaggle
Tools & Skills
Language: Python (Pandas, NumPy, Seaborn, Matplotlib, and Scipy)
Software: Jupyter Notebooks, Tableau & Excel
Exploratory Data Analysis (EDA)
Predictive Modeling & Visualization
Deliverables
Key Questions
Are there any demographic segments that are more likely to churn?
Do customers who subscribe to additional services have a higher churn rate?
Do customers on different contract lengths (month-to-month, one-year, two-year) have different churn rates?
Is there a correlation between satisfaction score and churn rate?
Can we identify key factors that contribute to customer churn using churn score and churn category?
How can we use CLTV (Customer Lifetime Value) to identify high-value customers?
Analysis Process
1. Data Cleaning
Remove inaccuracies and inconsistencies from the dataset to ensure reliability and quality of the data for analysis.
2. Conduct Exploratory Data Analysis
Analyze initial data characteristics, identify patterns, and understand relationships between variables to form initial hypotheses.
3. Data Visualization
Create visual representations of data to highlight trends, patterns, and correlations for better understanding and communication.
4. Perform Predictive Analysis
Use statistical models to predict future customer behavior and identify potential churn risks.
5. Execute Cluster Analysis
Group customers into distinct segments based on similar characteristics to better understand behavior and tailor strategies accordingly.
6.Create Presentation Report
Provide actionable insights and strategies based on analysis to reduce churn and enhance customer loyalty.
Customer Churn Analysis
Customer churn grew to 27% this quarter, with half in San Diego. Churned customers generated over $3.7M.
Most churned customers had month-to-month contracts and tenure of less than one year. Offer E has a higher churn rate than other offers. A significant portion of churn is due to competitors offering better devices or plans.
Python Scripts
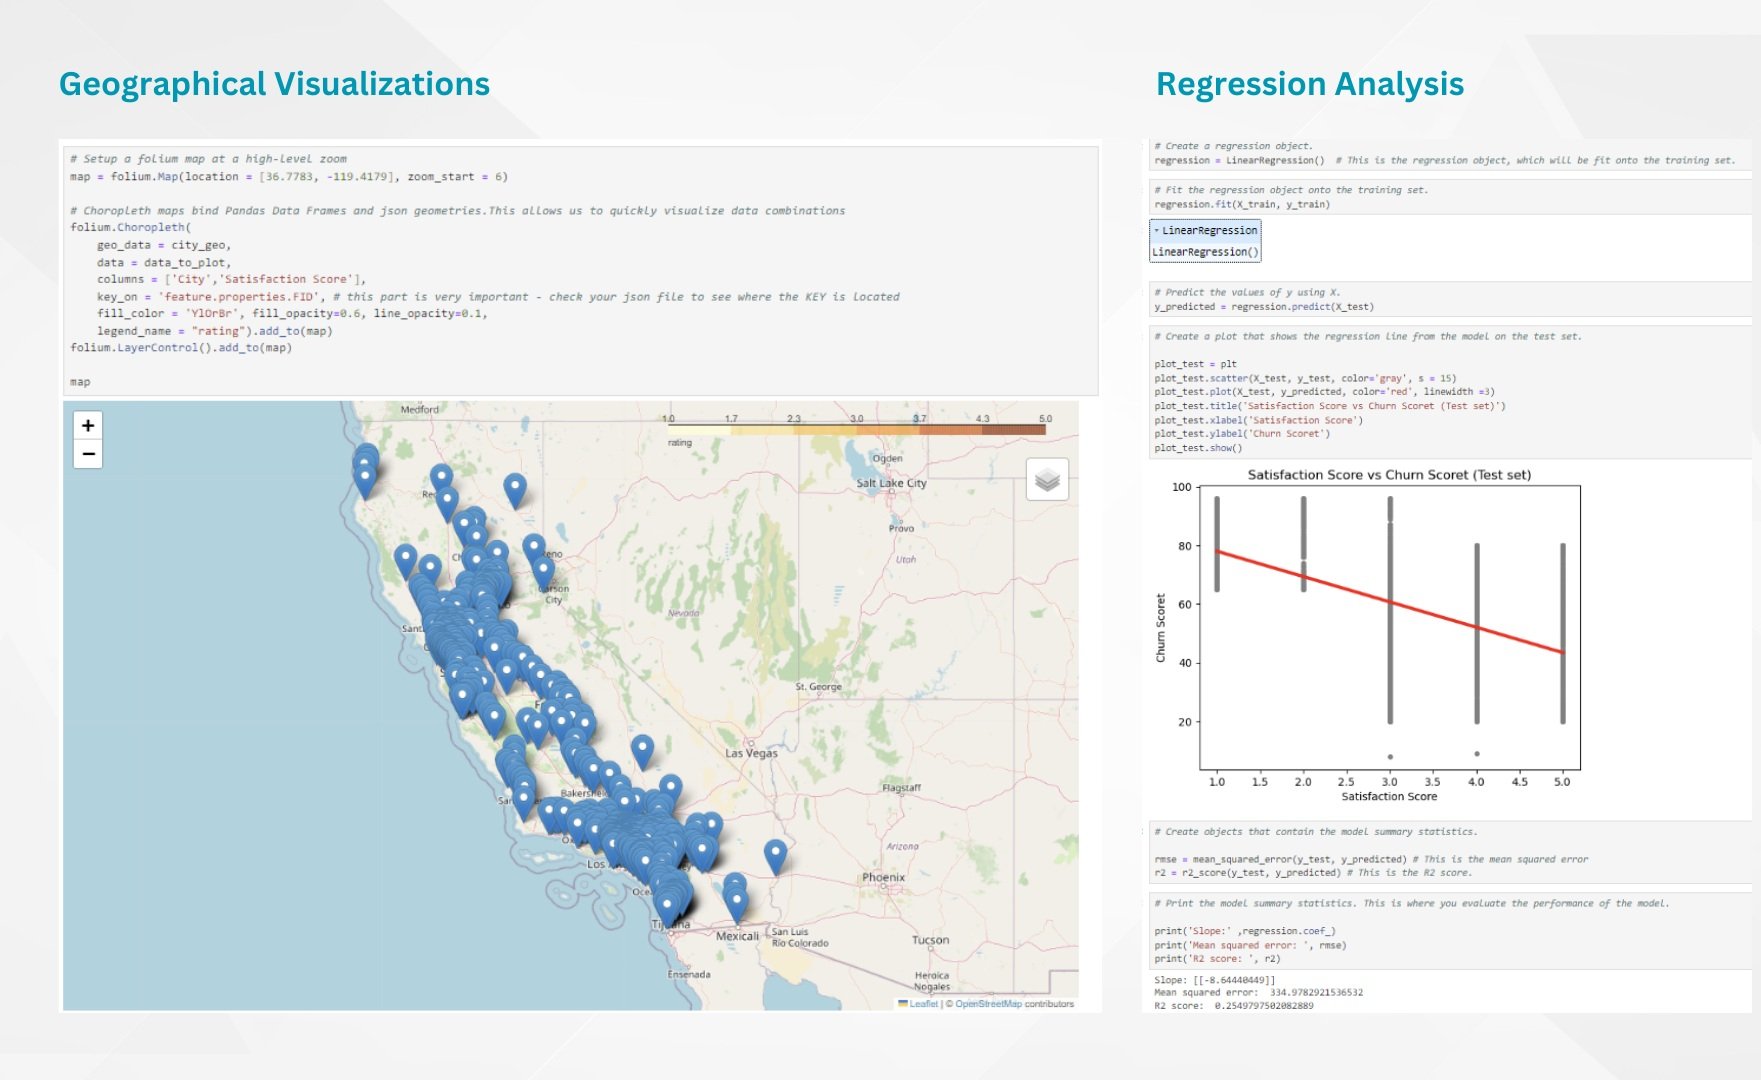
The Geographical Visualizations script uses the Folium library to create an interactive map, displaying data points based on geographical coordinates. It plots cities and their corresponding satisfaction scores on a map, providing a visual representation of spatial data.
The Regression Analysis script performs a linear regression analysis to examine the relationship between satisfaction scores and churn scores. It creates a regression model using scikit-learn's LinearRegression class, fits the model to the training data, and predicts churn scores based on satisfaction scores. For more Python Scripts , click the button below to view the GitHub repository.
Key Insights
Cluster Analysis
A cluster analysis was conducted to segment customers into distinct groups based on their tenure (in months), satisfaction score, churn score, and Customer Lifetime Value (CLTV). The analysis identified five distinct customer clusters.
Customer Segments
High-Risk (Longer Tenure): This is a critical group of customers with paradoxical characteristics. They had extended tenure and a high CLTV. However, their high churn scores and low satisfaction levels paint a concerning picture of customer disengagement.
High-Risk (Shorter Tenure): This group is relatively new but shows signs of dissatisfaction and high churn scores.
High-Valued (Longer Tenure): This group are the most loyal and valued. They are highly satisfied and unlikely to leave.
High-Valued (Shorter Tenure): Similar to the High-Valued (Longer Tenure) group, these customers boast high satisfaction and low churn risk. However, they are a newer group with a developing CLTV.
Regular Customers: This group has a moderate tenure, a high satisfaction score, and a low churn rate. Their CLTV reflects this average engagement.
Recommendations
Analyze competitor offerings in internet and streaming services, and enhance customer service training to reduce churn, ensuring a better customer experience and increasing retention rates.
Offer exclusive rewards to high-risk short-term customers to recover revenue and encourage long-term commitments, fostering loyalty and reducing churn by providing added value and incentives for continued engagement.
Target high-risk long-term customers with proactive outreach, enhanced service, and exclusive offers to reduce churn, fostering loyalty and ensuring they remain engaged with the brand.
Develop loyalty programs for high-value customers and nurture short-term customers, fostering stronger relationships and increasing retention by offering incentives and personalized experiences tailored to their needs and preferences.


